How to Use "SnapEng F Effort Profiler"
This app answers the question, "how long will it take get a body of effort completed with a team size that varies over time". It then lets you play with your team size to adjust the duration.
You need two numbers to get started. The first is how many effort days of work need to be performed. Enter this into the top left corner. Tap the blank area between the text fields to get rid of the number pad. The second is your expected peak team size. This is your Peak Staff. Enter it into the top right corner. Again, tap the blank area between the text fields to get rid of the number pad.
Say you have 1000 effort days ahead of you and a peak staff size of 10. Also, your labour profile is a classic mountain that grows slowly, then shrinks quickly at the end of the project. It should look something like this.
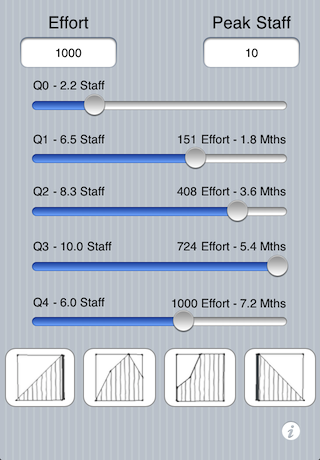
The duration of the project is 7.2 months at completion (Q4). Along the way, it takes 1.8 months to reach Q1, 3.6 months to reach Q2 and 5.4 months to reach 5.4 months. Also, the staff level starts at 2.2 staff, grows to 6.5, 8.3, peaks at 10.0 and drops to 6.0 on the last day of the project.
Drag the sliders for Q0, Q1, Q2 or Q4 to adjust how your team size grows. If your peak team size is reached at the transition the third and fourth quarters, leave Q3 maxed out. Press one of the four different pre-defined labour profiles at the bottom of the page to quickly setup a different scenario.
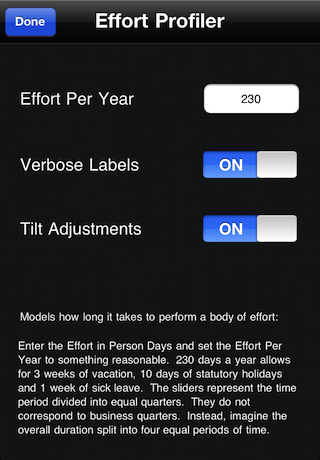
Tap the italic 'i' to inspect the backside of the app.
The backside is where you control whether verbose labels are shown next to the sliders. The Tilt Adjustment makes it quick to smoothly model different staffing profiles. But it is nice to turn it off if you are going to pass the app around the table to show people, because the Tilt Adjustments might be accidentally made along the way.
Tilt the app towards you to bulk up that staffing profile at the back end of the project. Tilt the app away from you to bulk up the front end of the project. Tilt the app towards it side to melt the sliders towards the ground, like slow running paint drips.
If you get into a slider state you do not like, press on of the pre-defined profiles and start over. To adjust the maximum team size, use the Peak Staff text field. Keeping at least one slider maxed out to the right makes the app the most useful and easy to use.
The app makes a number of assumptions that do not always hold, but usually do:
Assumption #1 - You can model an idealized staff member who works at some average pace that is also the average for your overall team. This idealized person has average productivity. If everyone on the team was replaced by this fictional person, then the team would still get their work done in the same time as the actual team. The larger team, the more true this assumption typically becomes.
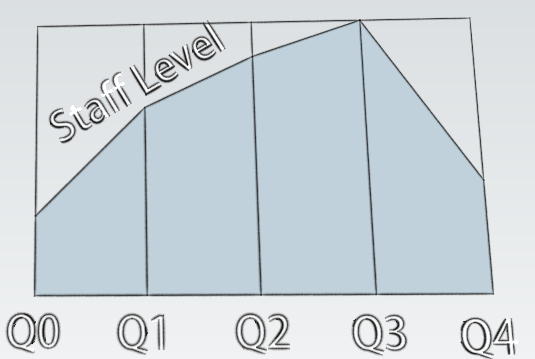
Assumption #2 - Teams grow between quarter boundaries at an even pace. There is not a smooth change in team size grow at the Q1, Q2 and Q3 boundaries. One moment the team is growing at 3 people a quarter, the next moment the team is growing at 2.5 people a quarter. This approximation works fine but will tend to towards under estimating the overall duration a little. The diagram below in the "How it Works" section illustrates this.
How the "SnapEng F Effort Profiler" Works
Any period of time can be divided into four equal parts. The first quarter, the second quarter and so on. The SnapEng F Effort Profiler breaks up any duration of time into equal quarters, like a football game. Q0 is the name given to the start of the first quarter. Q1 is the transition point between the first and second quarters. Q4 is the last moment of the last quarter.
Now imagine a body of effort such as "one person working for 100 days". A "Project" is just another word for this. This person could work on their project at a steady pace. This means that at the end of Q1 they complete 25 days of effort. At the end of Q2 they have completed another 25 days of effort for a cumulative total of 50 days. By the end of Q4, they have completed all 100 days of effort. Their project is over.
Usually, you have more than one person and they are not all available at the same time. This complicates the calculation.
Picture these four time frames spread out left to right. On the same graph, top to bottom represents the number of people (staff) members working on the project. The amount of effort performed in any quarter is the average staff level in that quarter times the amount of time each quarter spans. As teams grow, the average is always ("Staff Level at Q0" plus "Staff Level at Q1") divided by 2, and so on.
It looks like this.
That's it, that's the secret sauce. Something so simple makes a compelling app because it is very hard to do this math accurately in your head, but the topic of "how much time to do you need to complete as your team size changes" comes up in meetings. Now the answer doesn't have to be "I'll get back you."
Frequently Asked Questions about the "SnapEng F Effort Profiler"
Q: What units of measure is Effort expressed in?
A: Days. Typically an 8 hour day, but that doesn't have to be case. The Effort per Year on the back of the app lets you set how many days of work a staff member can perform. Typically this is between 220 and 230 days in a calendar year.
Q: What does Peak Staff mean?
A: Peak Staff is the right-most high point represented by the sliders. All of the pre-defined staffing profiles have at least one slider that is maxed-out to the right. This slider will "stick" to the right as you perform Tilt Adjustments. The far right position represents "maximum team size".
Q: The numeric keypad comes up to let me type in a number, but then will not away?
A: You need to tap just to the side of the text field. Then the numeric pad with go away.
Q: How to I choose which pre-defined staffing profile best fits my scenario?
A: The rising ramp profile lets you model getting a team started up to a its peak size. The mountain profile represents a normal profile for its full duration. The school bus, slow-start-then-sharp ramp up happens more often for highly schedule constrained projects. Finally, the fall ramp profile helps you wrap up an already running project. Pick a profile, then tweak it to get what you want.
Q: Can I save my labour profile so that I can transfer it outside the app?
A: No. But that's a good idea. That's for a later version of this app. First we crawl, then we'll walk.
Q: Why does the Tilt Adjustments, when all the way to the left and to the right, slow down or stop the sliders movement?
A: A trade-off between sensitivity and an app that could quickly blow away you staffing profile was reached. The basic idea is if the app is completely tilted to the left or completely tilted to the right, something is probably wrong, so the app stops responding to the tilt.
Q: Why do the sliders sometimes adjust themselves even when I am not touching the screen?
A: The sliders are sensitive to Tilt Adjustment, if it's turned on. Turn it off on the back of the app.
Q: Where do I find the number for the total duration of the effort?
A: It's the number at the right hand end of the bottom sliders (the Q4 slider). It's expressed as a number of months.
Q: Does it matter that I don't have one of the sliders maxed out to the right?
A: Not really. All it means is that the "non-maxed-out" slider will move about when the Tilt Adjustment is performed.
Q: There used to be labels next to the numbers above my sliders. Where did they go?
A: The Verbose Labels setting on the back of the app turns verbose labels on and off. Once you get familiar with the app, you may find yourself turning off Verbose Labels to streamline the presentation of staff levels, cumulative effort and cumulative duration.
Q: Why isn't your algorithm for calculating duration more complicated?
A: That's the beauty of it. The method for calculating the duration is explained so that you can have better trust of the results and be able to be compelling to others when you talk about the results the app gives you.
Q: What does the "F" stand for and why the strange name?
A: F stands for Effort. SnapEng is the tag line for a small family of apps designed to help protect your sanity when faced with making snap decisions about team sizes and project duration.